Convolutional Neural Networks on non-uniform geometrical signals using Euclidean spectral transformation
Chiyu "Max" Jiang Dequan Wang Jingwei HuangPhilip Marcus Matthias Niessner
[Paper] [Code] [Bibtex]

Figure 1 Top: Schematic of the NUFT transformations of the Stanford Bunny model. Bottom: Schematic for shape retrieval and surface reconstruction experiments.
Abstract
Convolutional Neural Networks (CNN) have been successful in processing data signals that are uniformly sampled in the spatial domain (e.g., images). However, most data signals do not natively exist on a grid, and in the process of being sampled onto a uniform physical grid suffer significant aliasing error and information loss. Moreover, signals can exist in different topological structures as, for example, points, lines, surfaces and volumes. It has been challenging to analyze signals with mixed topologies (for example, point cloud with surface mesh). To this end, we develop mathematical formulations for Non-Uniform Fourier Transforms (NUFT) to directly, and optimally, sample nonuniform data signals of different topologies defined on a simplex mesh into the spectral domain with no spatial sampling error. The spectral transform is performed in the Euclidean space, which removes the translation ambiguity from works on the graph spectrum. Our representation has four distinct advantages: (1) the process causes no spatial sampling error during initial sampling, (2) the generality of this approach provides a unified framework for using CNNs to analyze signals of mixed topologies, (3) it allows us to leverage state-of-the-art backbone CNN architectures for effective learning without having to design a particular architecture for a particular data structure in an ad-hoc fashion, and (4) the representation allows weighted meshes where each element has a different weight (i.e., texture) indicating local properties. We achieve good results on-par with state-of-the-art for 3D shape retrieval task, and new state-of-the-art for point cloud to surface reconstruction task.
Gallery

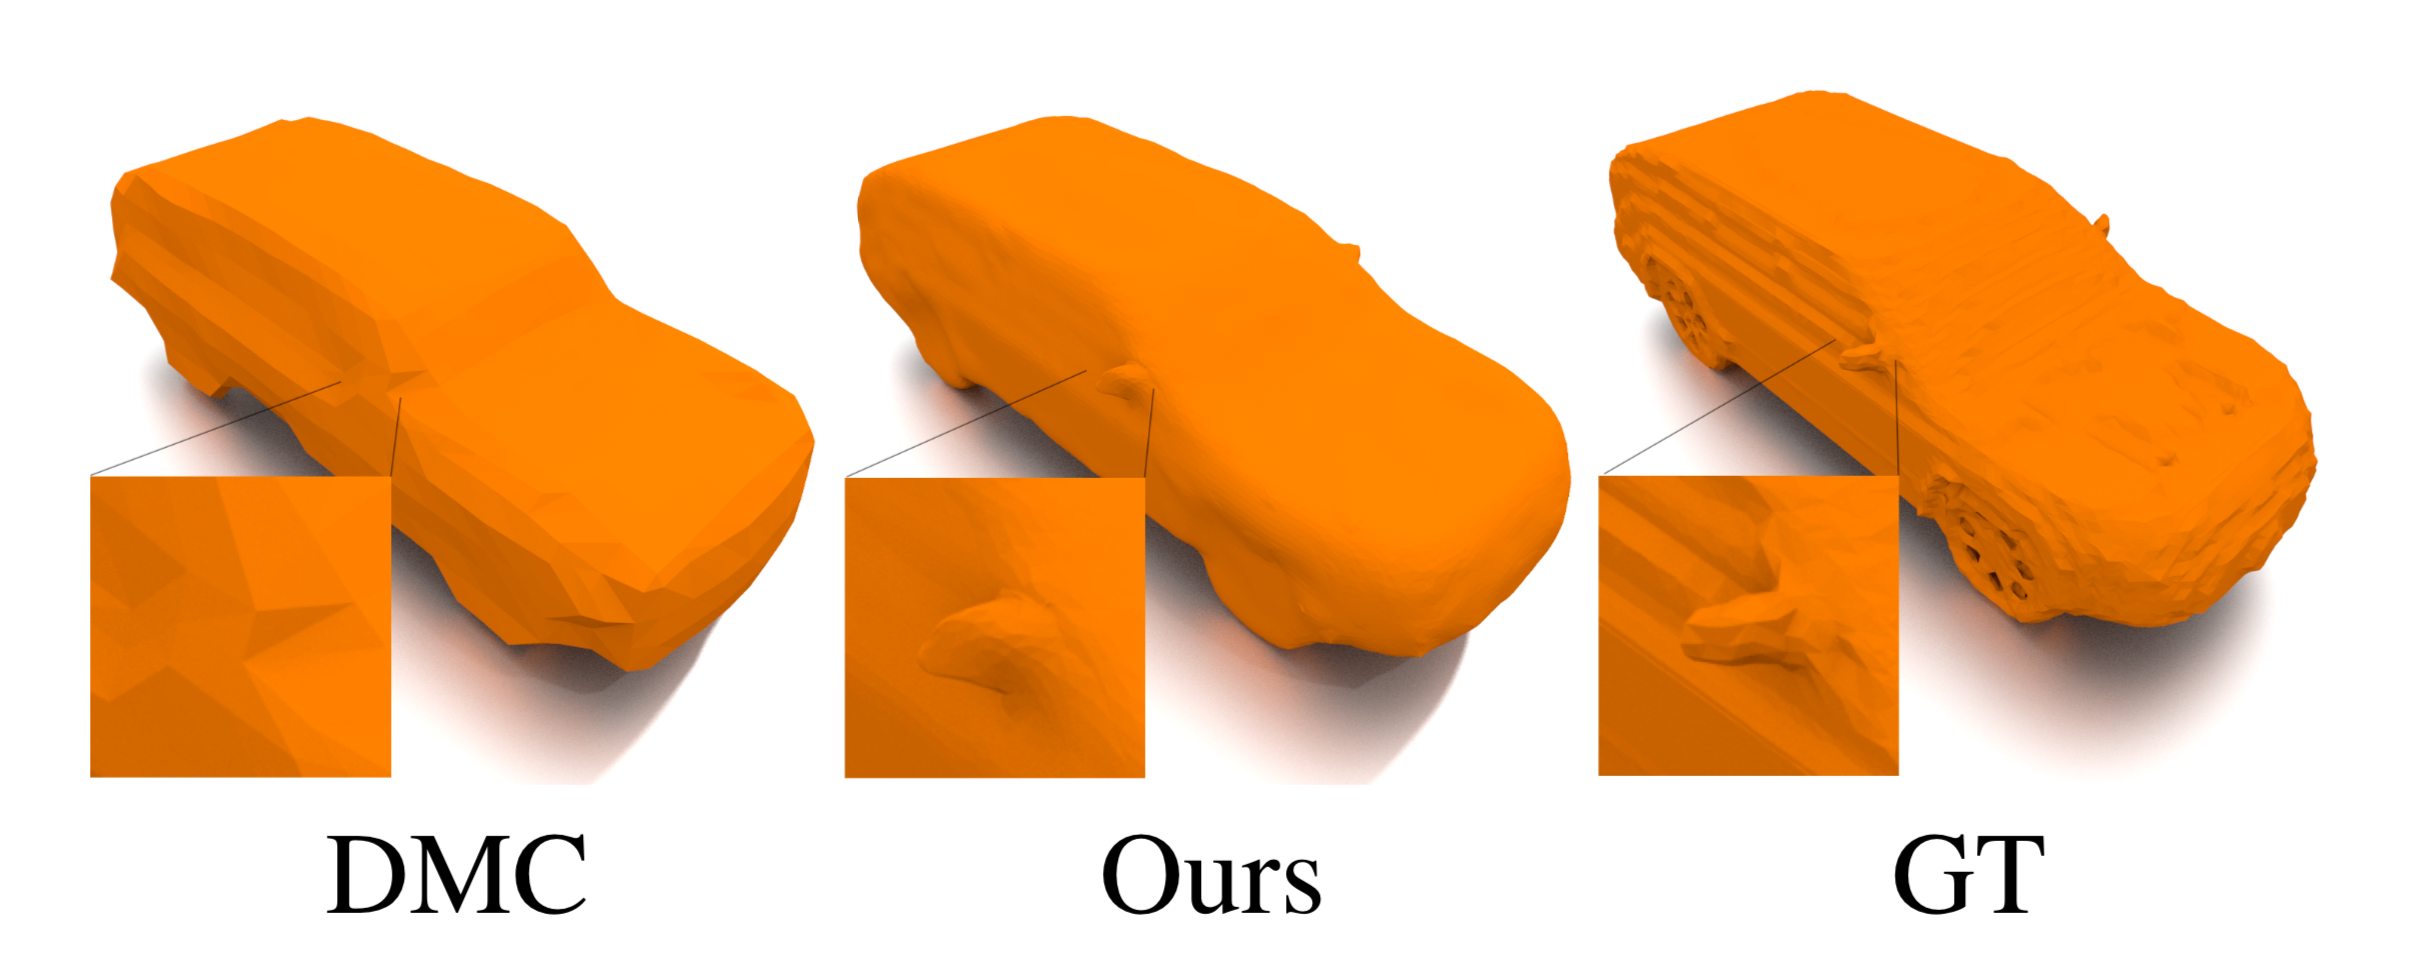
Figure 2 Surface reconstruction from point cloud. Zoomed-in visualization of reconstruction quality.

Figure 3 Qualitative side-by-side comparison of surface reconstruction results.